Machine Learning AI Can Help us Save Babies

Saving babies with Machine Learning
Can machine learning AI help save baby lives? We take a look using Microsoft’s Azure ML platform. Machine learning (ML), a subset of Artificial Intelligence (AI), is one of the hottest topics in business and technology today. ML’s deep learning approach makes Amazon Alexa, Apple’s Siri and Google Translate possible.
I recently completed graduate studies in advanced statistical techniques and as I’ve grown older many of my colleagues are now starting families. The wish of those who have children is that their newborns will be healthy. One of the factors that can influence the health of a newborn is its birthweight.
Let’s take a look at a dataset of 189 records (case studies of baby-mother pairs) and eleven (11) variables to predict a newborn’s weight. For simplicity I’m going to use linear regression to predict the birthweight. I have defined the list of variables below:
- low: indicator of birth weight less than 2.5 kg (5.51 lbs.) 0 = less than 2.5 kg (5.51 lbs.), 1 = greater than
- age: mother’s age in years
- lwt: mother’s weight in pounds at last menstrual period
- race: mother’s race (“white”, “black”, “other”) = 1,2,3, respectively
- smoke: smoking status during pregnancy, 0 = No, 1 = Yes
- ht: history of hypertension, 0 = No, 1 = Yes
- ui: presence of uterine irritability, 0 = No, 1 = Yes
- ftv: number of physician visits during the first trimester
- ptl: number of previous premature labors
- bwt: birth weight in grams
- bawt: birth weight (I converted the bwt variable into pounds)
Taking these variables in account I will use the Microsoft Azure ML platform to formulate a linear regression model to predict a newborn’s birthweight from several of the aforementioned factors.
Disclaimer: I will mention before I proceed that the model I’ve developed can be improved, but I will ignore that for the sake of brevity in introducing my use of the Azure ML Studio.
I first downloaded the data in text format and converted it to Excel CSV format. I have shown the first and last portion of the data set including each of the variable sums and averages in MS Excel below:
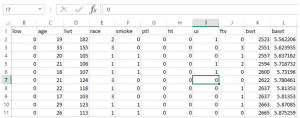
Baby birthweight data set
I have also shown a scatterplot of the newborn’s ID plotted against the birthweight in pounds (bawt) below (while ID is arbitrary, the distribution of weights is not)
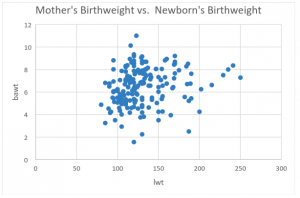
Scatterplot of birthweights
After uploading the dataset into Azure, I used the ‘Edit Metadata’ module to select the low, race, smoke, ht, and ui variables to make sure that Azure reads them as categorical variables.
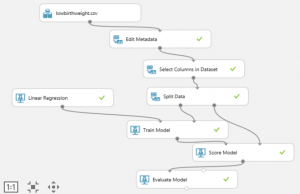
Microsoft Azure machine learning model
I then used the ‘Select Columns in Dataset’ module to select all of the columns except ‘id’ and ‘bwt’ to be included in the analysis. ID serves only as a unique identifier only and has no effect on birthweight. Since it’s been decided to use the transformed birthweight column ‘bawt’, the column ‘bwt’ won’t be needed either.
The next step was to separate the data into two parts. I used the ‘Split Data’ module to randomly split the first 70% of the data into a training set and the remaining 30% into a test (or validation) set. The algorithm we create will look at the 70% of the data for patterns. The patterns will help it to predict what will actually happen when we apply the algorithm to the remaining 30% of the data. If the model is pretty good then within a certain range of variation, it should be able to predict the birth weights of that 30% test set. (I made sure that the Stratified Split property option in Azure ML remained ‘False’ since birthweight (bawt) isn’t a class variable.)
Since we are trying to predict the birthweight this variable is our dependent variable (often referred to as “y”). So I used a linear regression model with the dependent (y) variable as birthweight (bawt) on the remaining predictor variables (often referred to as the “x’s”). Our goal is to determine which of these “x” variables or combination of them best predicts the likelihood that a newborn will have a low birthrate.
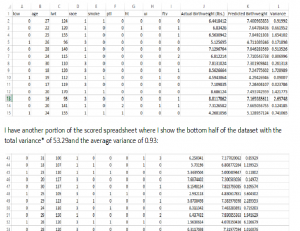
Once the linear regression model ran on the 70% of the training data, the algorithm from that regression model was applied to the remaining 30% of the dataset to predict (estimated) birthweights. Below the predicted birthweight of each newborn is shown in the ‘Predicted Birthweight’ column and listed next to the ‘Actual Birthweight’ as shown below. For example, in the first row of data we see that the actual birthweight was 6.44 pounds and the predicted birthweight was 7.40 pounds with the variance of this particular prediction being 0.92.
I have another portion of the scored spreadsheet where I show the bottom half of the data set with the total variance* of 53.29 and the average variance of 0.93.
Finally, the model results were compiled in the ‘Evaluate Model’ module. The model can be improved tremendously but at least we see the results below. On average we miss the actual birthweight by 376 grams (mean absolute error). Additionally, our algorithm can explain 62% of the variation in birthweight (coefficient of determination). A perfect model would be 100%, which is not possible in real life.
These values indicate that the above variables have ‘some effect’ on birthweight but this can be investigated further.
If you have any questions, comments, or concerns please feel free to contact me. Also you can follow me on twitter @the_data_bauce.
* Dataset was pulled from Hosmer, D.W., Lemeshow, S. and Sturdivant, R.X. (2013) Applied Logistic Regression: Third Edition.

